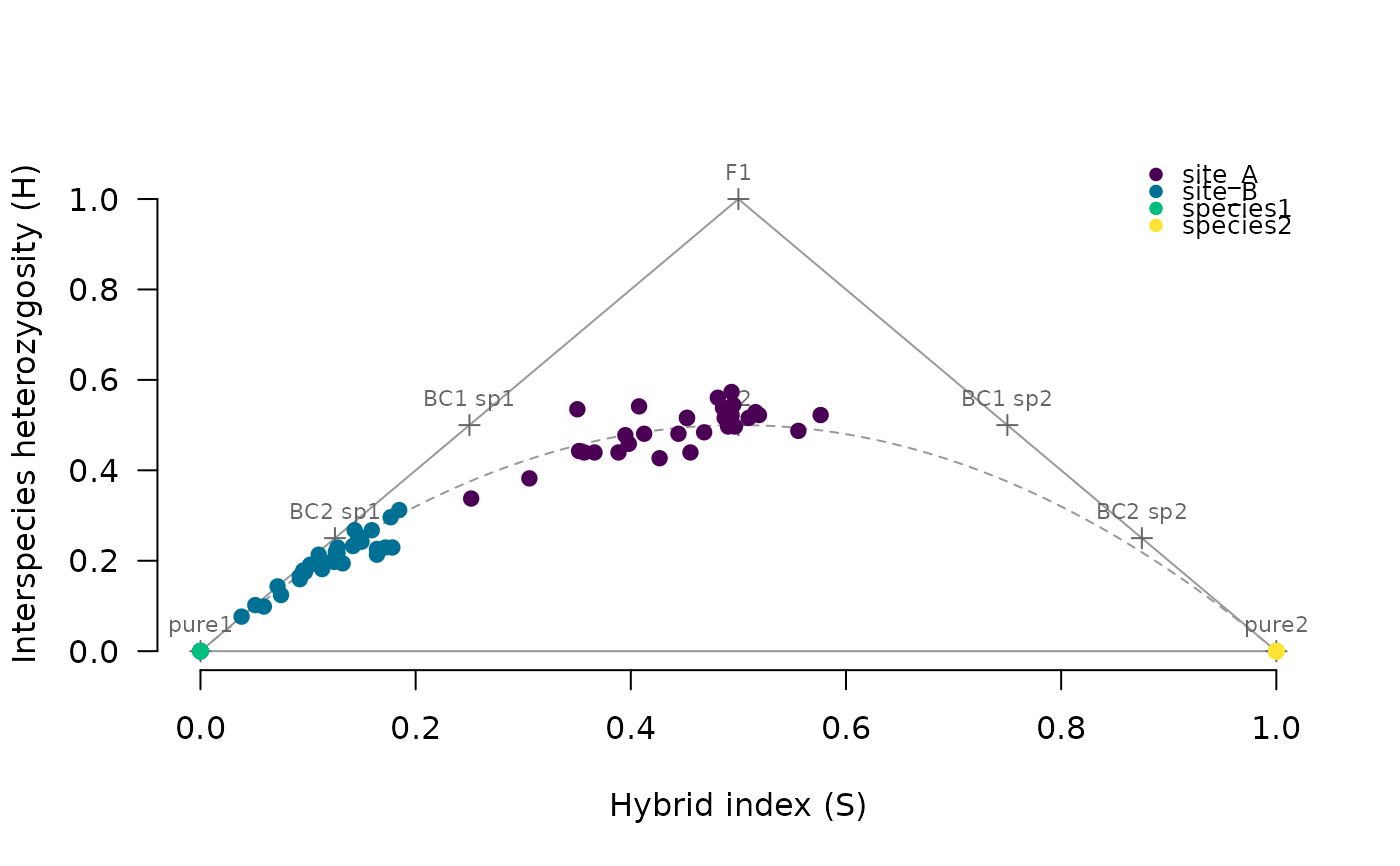
Plots interspecies heterozygosity (H) against hybrid index (S). Possible
values fill a triangle with pure animals at the bottom corners and F1s at
the top. The expected positions of first- and second-generation classes
and second backcrosses are marked. Animals below the dashed curve
H = 2S(1 - S) are less heterozygous than any offspring of unrelated
parents can be on average, a sign of inbreeding.
Arguments
- scores
Output of
hybrid_scores().- group
Optional grouping for colors.
- col
Colors, one per group.
- classes
Mark the expected class positions.
- ...
Passed to
graphics::points().
Examples
ex <- hybridclock_example()
mk <- diagnostic_markers(ex$genotypes, ex$groups, "species1", "species2", locus = ex$locus)
plot_triangle(hybrid_scores(ex$genotypes, mk), ex$groups)